streamtools (2014)
We see a moment coming when the collection of endless streams of data is commonplace. As this transition accelerates it is becoming increasingly apparent that our existing toolset for dealing with streams of data is lacking. Over the last 20 years we have invested heavily in tools that deal with tabulated data, from Excel, MySQL, and MATLAB to Hadoop, R, and Python+Numpy. These tools, when faced with a stream of never-ending data, fall short and diminish our creative potential.
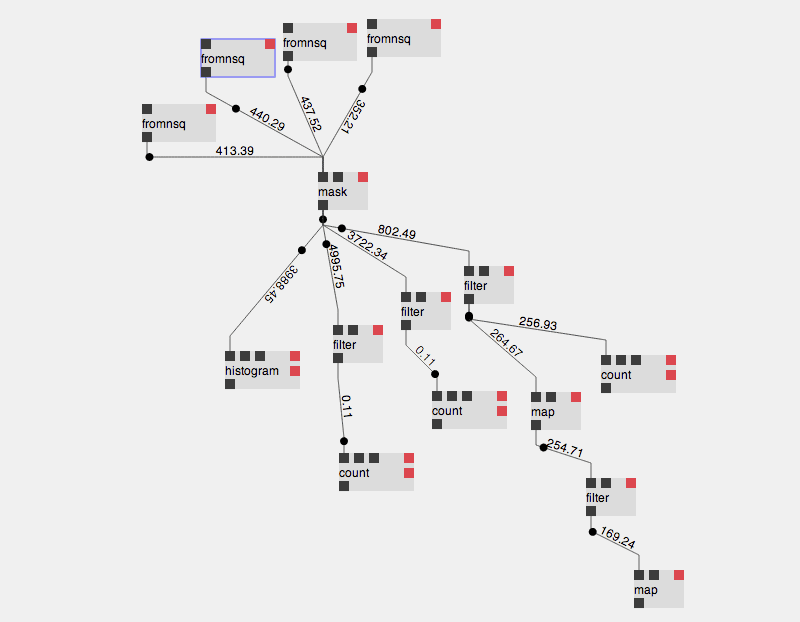
In response to this shortfall we have created streamtools &emdash; an open source project that provides a general purpose, graphical tool for dealing with streams of data. It offers a vocabulary of operations that can be connected together to create live data processing systems without the need for programming or complicated infrastructure. These systems are assembled using a visual interface that affords both immediate understanding and live manipulation of the system.
Like all projects at the Times’ R&D Lab, streamtools is designed to probe a particular future approximately three to five years away. For streamtools, this future is defined by three predictions:
Data will be provided as streams. Due to the volume of data that we’re collecting, and the sensors we use to collect it, stream-based APIs are becoming much more prevalent. Only a very small proportion of the data we collect belongs in a database. Most of it is collected by systems that emit events, like the data we generate as readers simply by browsing the web, or regular samples, like the data a thermostat collects about the temperature of a room. This data starts off life as a stream, and is efficiently delivered to whomever might want to use it as a stream. Putting a database in between the sensor and the data scientist will become an unnecessary and expensive luxury.
Using streams changes how we draw conclusions about the world. As a response to the availability of streaming data, we will start to think about our analysis, modeling, decision making, and visualization in streaming terms. This means that every new data point that arrives affects our understanding of the world immediately. This is in contrast to the more usual approach of waiting until we have a large collection of data, and only then starting our analysis. This means we will borrow techniques from the world of computer science, specifically “sketches”: algorithms that use very small computational resources to learn about high volume streams. We will adopt techniques from signal processing that study the nature of the stream itself: algorithms that allow us to calculate the stream’s rate and the subtle patterns contained therein. And we will adopt techniques from machine learning to build predictive models that are constantly updated with new information, so we can track the constantly shifting systems we are interested in.
Responsive tools will encourage new forms of reasoning. Most serious analysis tools are geared up for hypothesis testing: collecting data and building models to decide if our hypotheses are correct. This is the backbone of the scientific method and has served to provide structure to statistics and its related disciplines. Data science allows for another approach: exploratory data analysis. This approach, formalised in a type of reasoning known as abductive reasoning, allows the researcher to start with data and explore, finding those hypotheses that are supported by the data rather than the other way around. Streamtools allows for traditional hypothesis testing but also enables a creative, playful approach to exploring streams of data.